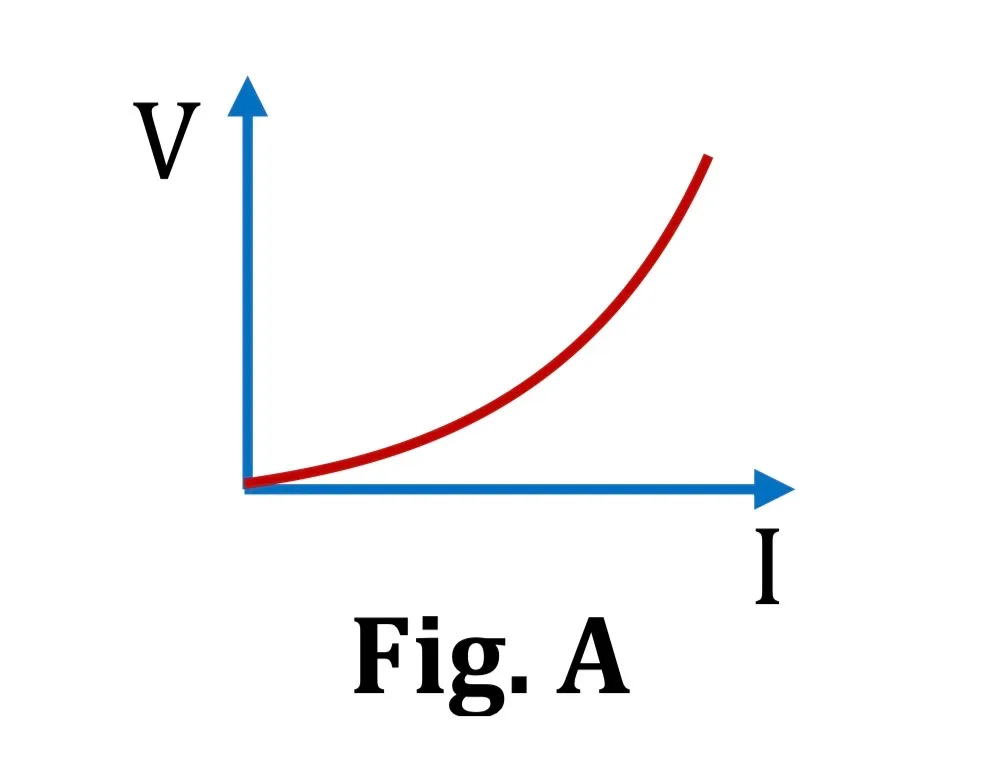
The I–V relation is the parabolic curve shown in figure A. Which graph correctly represents power P versus current I?
Physics · Current electricity · Cells, Maximum Power & Heating Effect
The I–V relation is the parabolic curve shown in figure A. Which graph correctly represents power P versus current I?
Options