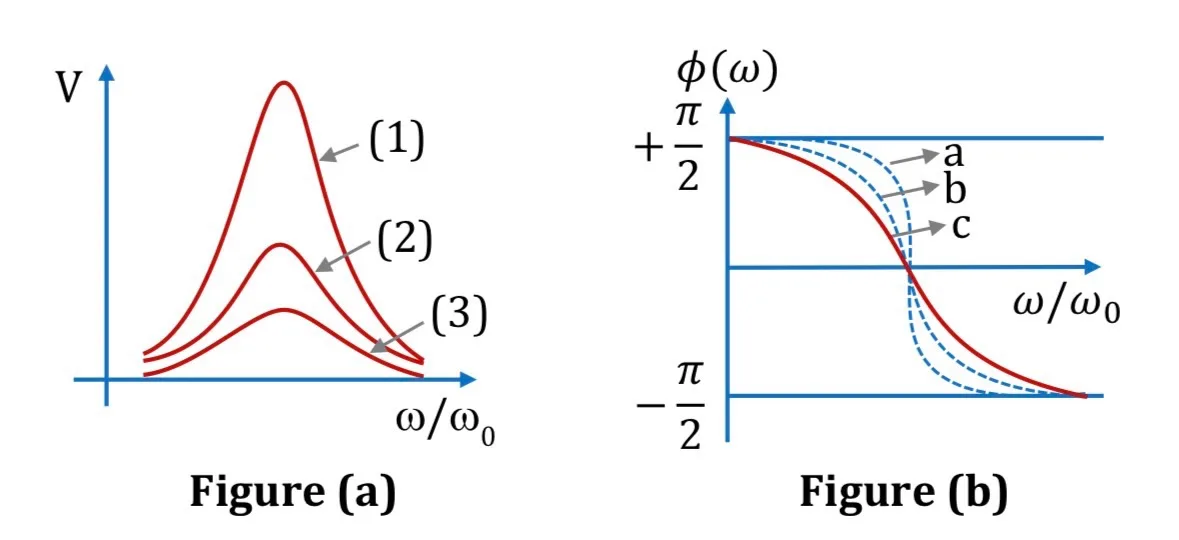
Figure (a) shows capacitor voltage versus driving frequency for a sinusoidally driven LCR circuit. Figure (b) shows phase angle φ versus ω/ω₀ for the same circuit, for three different quality factors. Choose the correct statement.
Options
Figure (a) shows capacitor voltage versus driving frequency for a sinusoidally driven LCR circuit. Figure (b) shows phase angle φ versus ω/ω₀ for the same circuit, for three different quality factors. Choose the correct statement.
Options