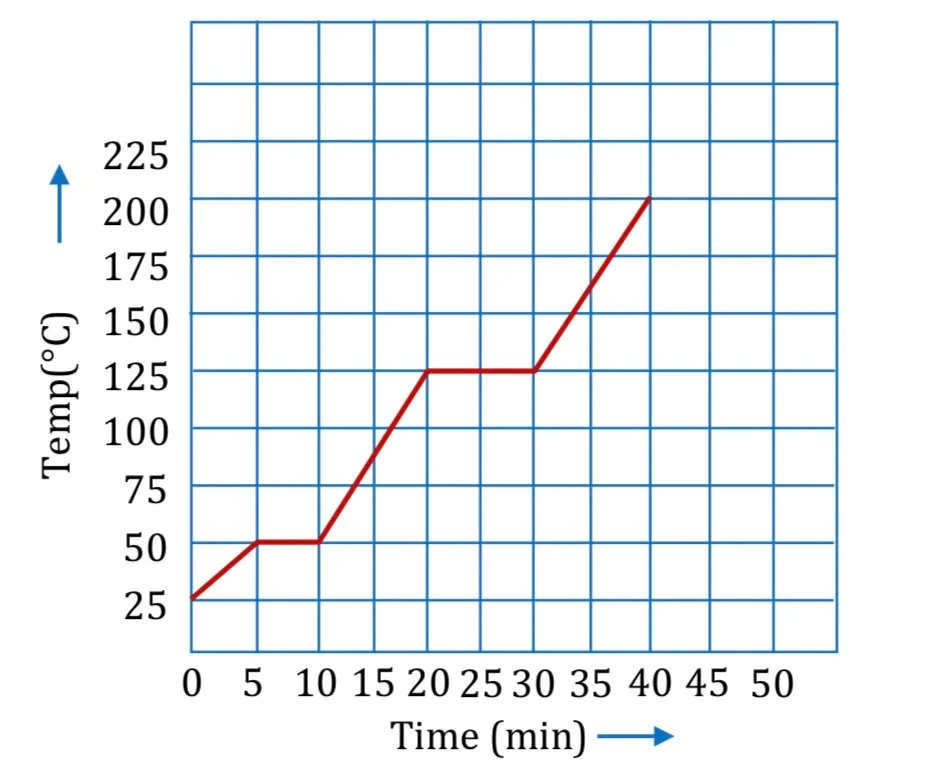
The graph shown in the figure represent change in the temperature of 5 kg of a substance as it absorbs heat at a constant rate of 42 kJ min-1. The latent heat of vaporization of the substance is :
Options
The graph shown in the figure represent change in the temperature of 5 kg of a substance as it absorbs heat at a constant rate of 42 kJ min-1. The latent heat of vaporization of the substance is :
Options