Physics · Thermodynamics
JEE MainsNEET
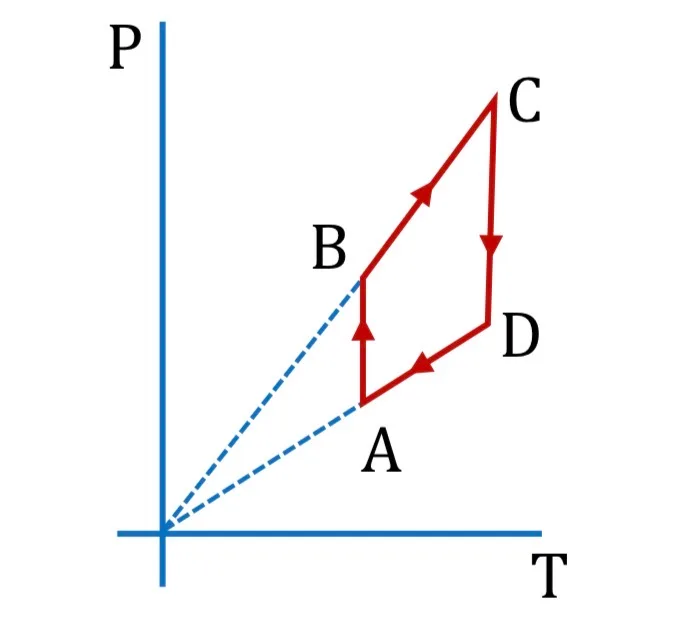
Pressure versus temperature graph of an ideal gas is shown in figure
Options
During the process AB work done by the gas is positive
During the process CD work done by the gas is negative
During the process BC internal energy of the gas is increasing
None