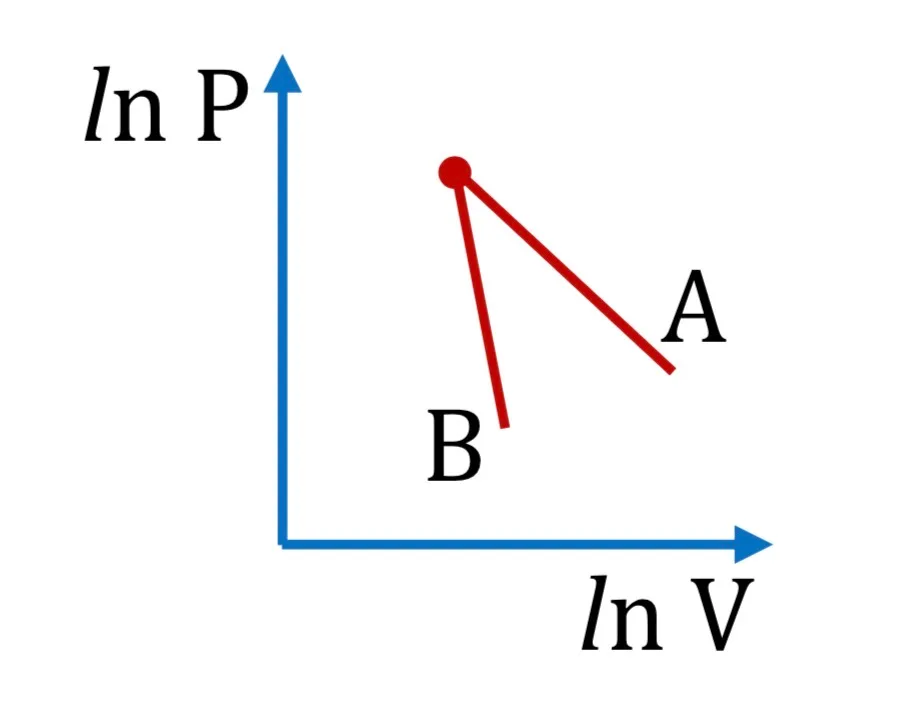
The figure, shows the graph of logarithmic reading of pressure and volume for two ideal gases A and B undergoing adiabatic process. From figure it can be concluded that
Physics · Thermodynamics
The figure, shows the graph of logarithmic reading of pressure and volume for two ideal gases A and B undergoing adiabatic process. From figure it can be concluded that
Options