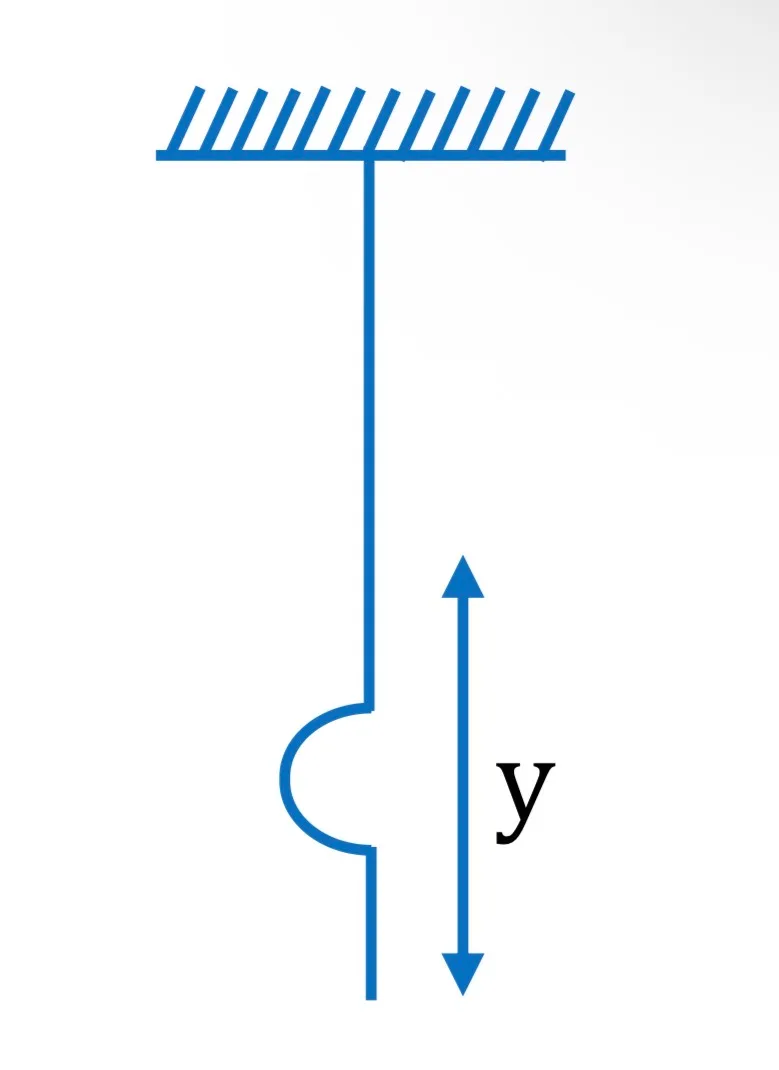
A nonuniform rope of length ℓ hangs from a ceiling. Its linear mass density varies as μ = μ₀eʸ, where y is measured from the lower end. Which graph best represents v² versus y?
Options
A nonuniform rope of length ℓ hangs from a ceiling. Its linear mass density varies as μ = μ₀eʸ, where y is measured from the lower end. Which graph best represents v² versus y?
Options