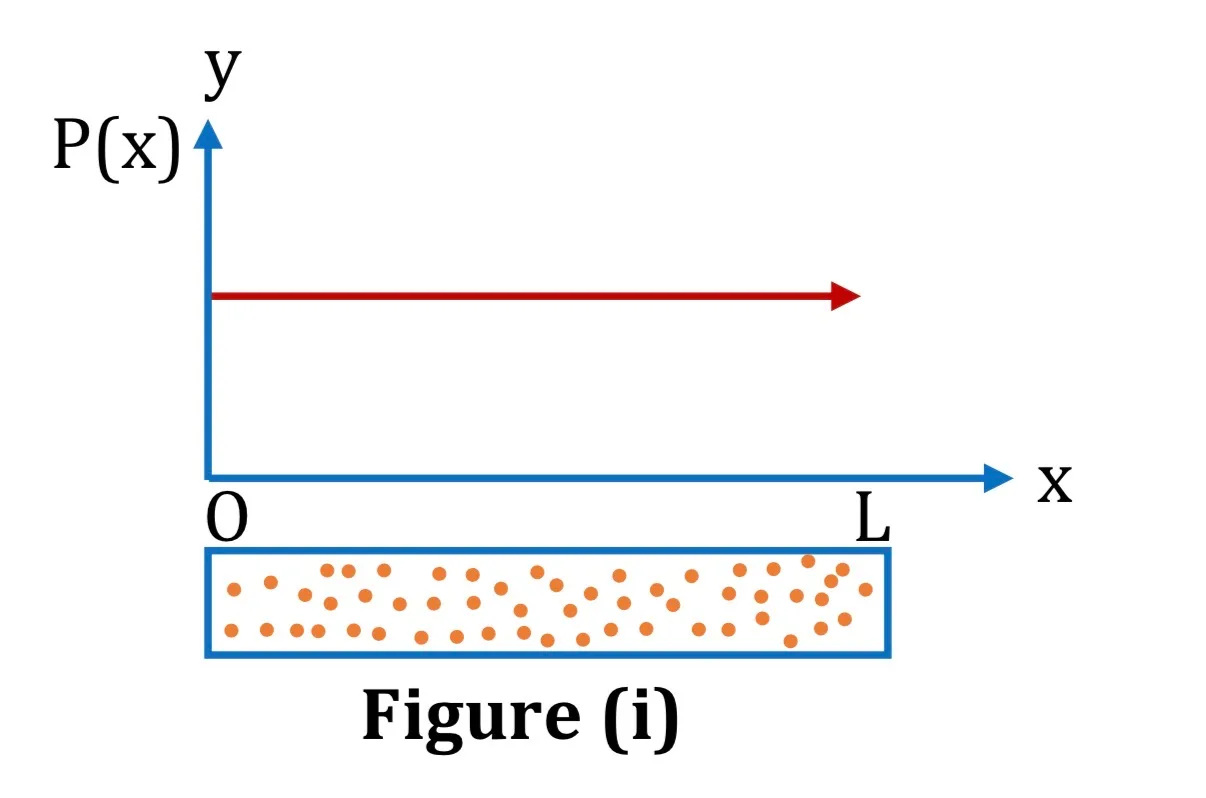
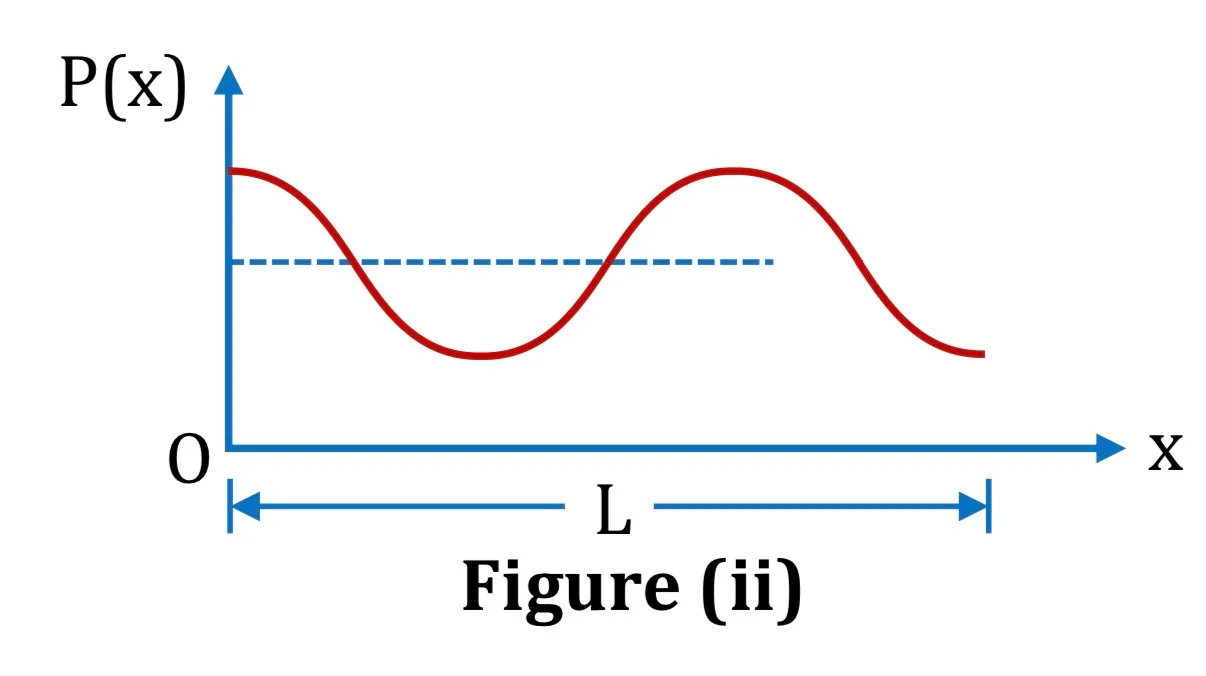
The fig.(i) shows the graphical representation of the air molecules in a tube of air (length = L) at atmospheric pressure on the absolute pressure P(x) graph. Which one of the following pictures corresponds to the absolute pressure P(x) graph of fig. (ii).
Physics · Wave Motion
The fig.(i) shows the graphical representation of the air molecules in a tube of air (length = L) at atmospheric pressure on the absolute pressure P(x) graph. Which one of the following pictures corresponds to the absolute pressure P(x) graph of fig. (ii).
Options