The displacement x versus time graph is shown below. (A) The average velocity during 0 to 3 s is 10 m/s (B) The average velocity during 3 to 5 s is 0 m/s (C) The instantaneous velocity at t=2 s is 5 m/s (D) The average velocity during 5 to 7 s and instantaneous velocity at t=6.5 s are equal (E) The average velocity from t=0 to t=9 s is zero Choose the correct answer from the options given below :
Physics · Kinematics Part-1 (one dimension) · Ghraphical problem of kinematics
JEE Main 2025 (Online) 4th April Evening Shiftkinematics previous year
The displacement x versus time graph is shown below.
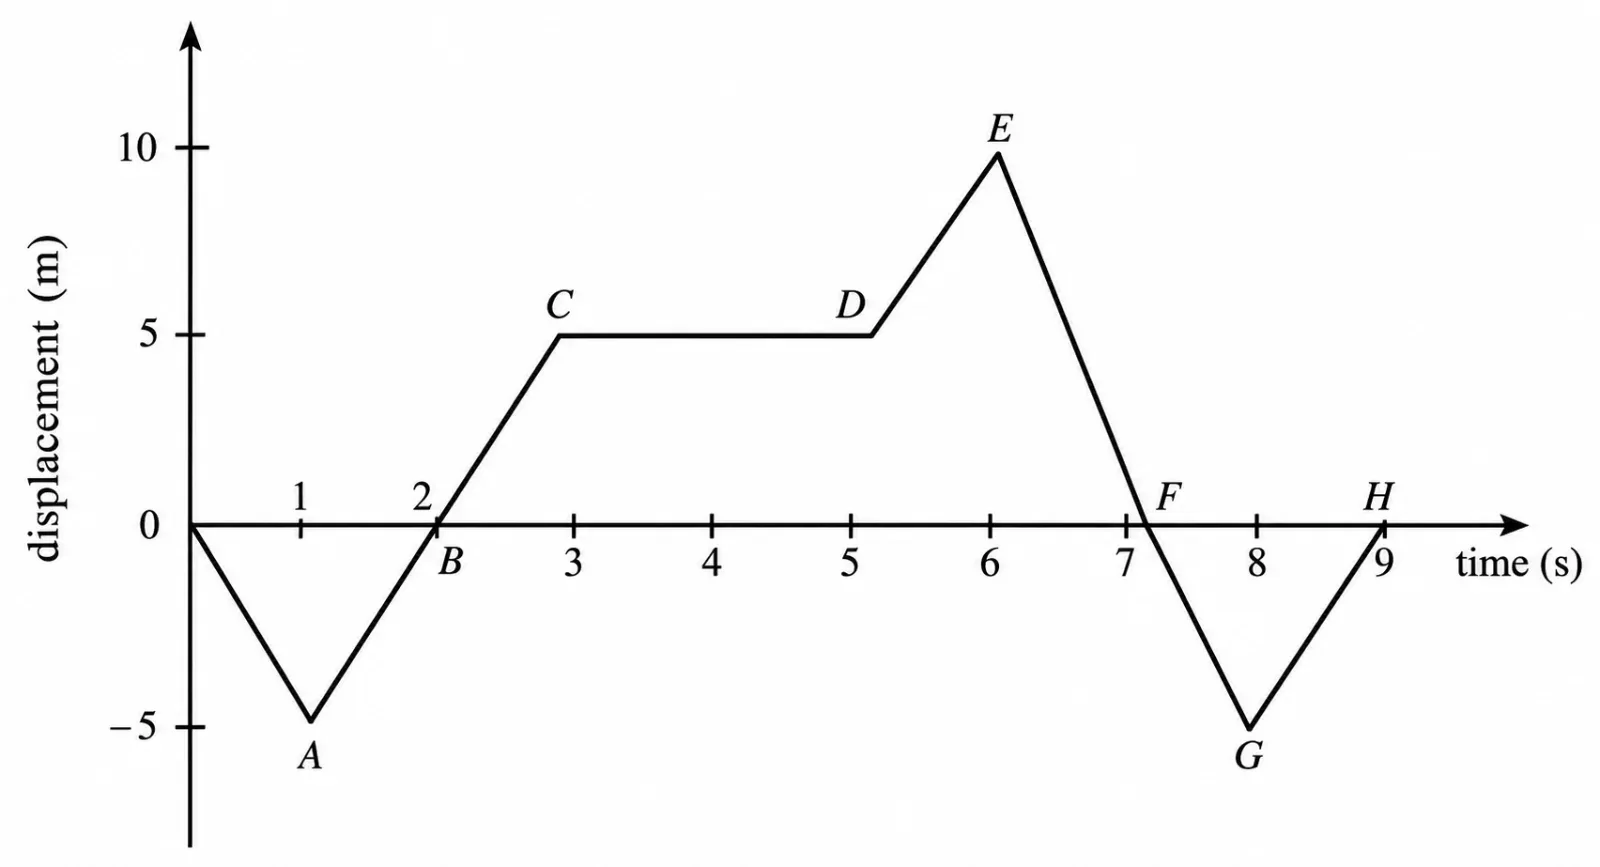
(A) The average velocity during 0 to 3 s is 10 m/s
(B) The average velocity during 3 to 5 s is 0 m/s
(C) The instantaneous velocity at t=2 s is 5 m/s
(D) The average velocity during 5 to 7 s and instantaneous velocity at t=6.5 s are equal
(E) The average velocity from t=0 to t=9 s is zero
Choose the correct answer from the options given below :
Options