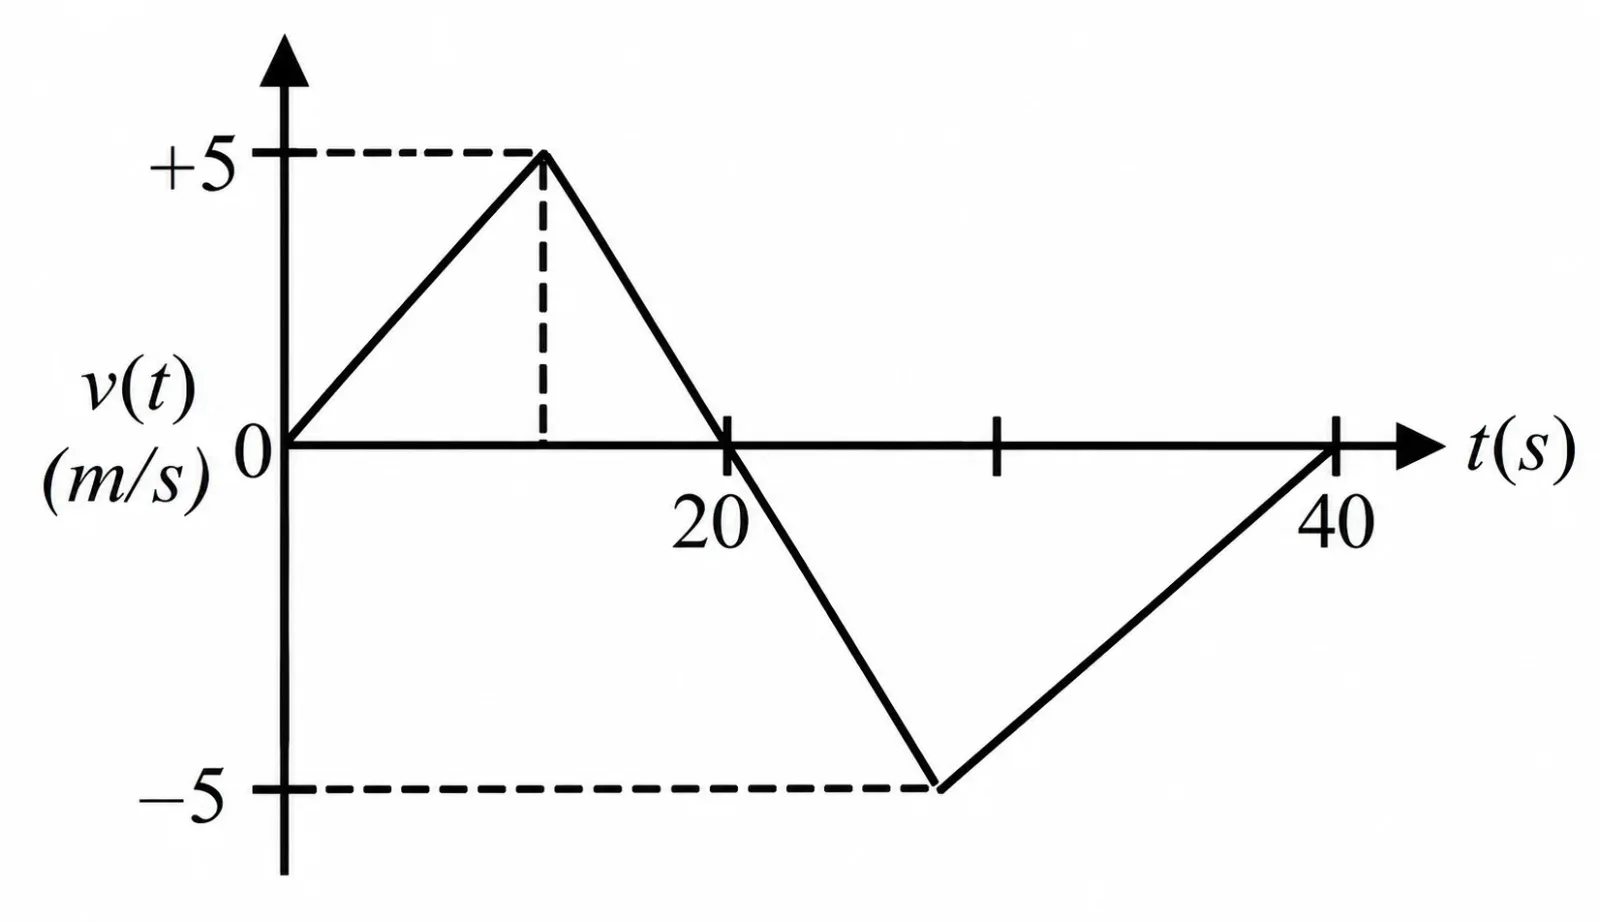
The velocity-time graph of a particle over a 40 s interval is shown in the figure. The graph consists of two triangular regions of equal base 20 s, one above and one below the time axis, each reaching a speed magnitude of 5 m·s⁻¹. What are, respectively, the total distance travelled by the particle and its average velocity over the 40 s interval?
Physics · Kinematics Part-1 (one dimension) · Ghraphical problem of kinematics
The velocity-time graph of a particle over a 40 s interval is shown in the figure. The graph consists of two triangular regions of equal base 20 s, one above and one below the time axis, each reaching a speed magnitude of 5 m·s⁻¹. What are, respectively, the total distance travelled by the particle and its average velocity over the 40 s interval?
Options