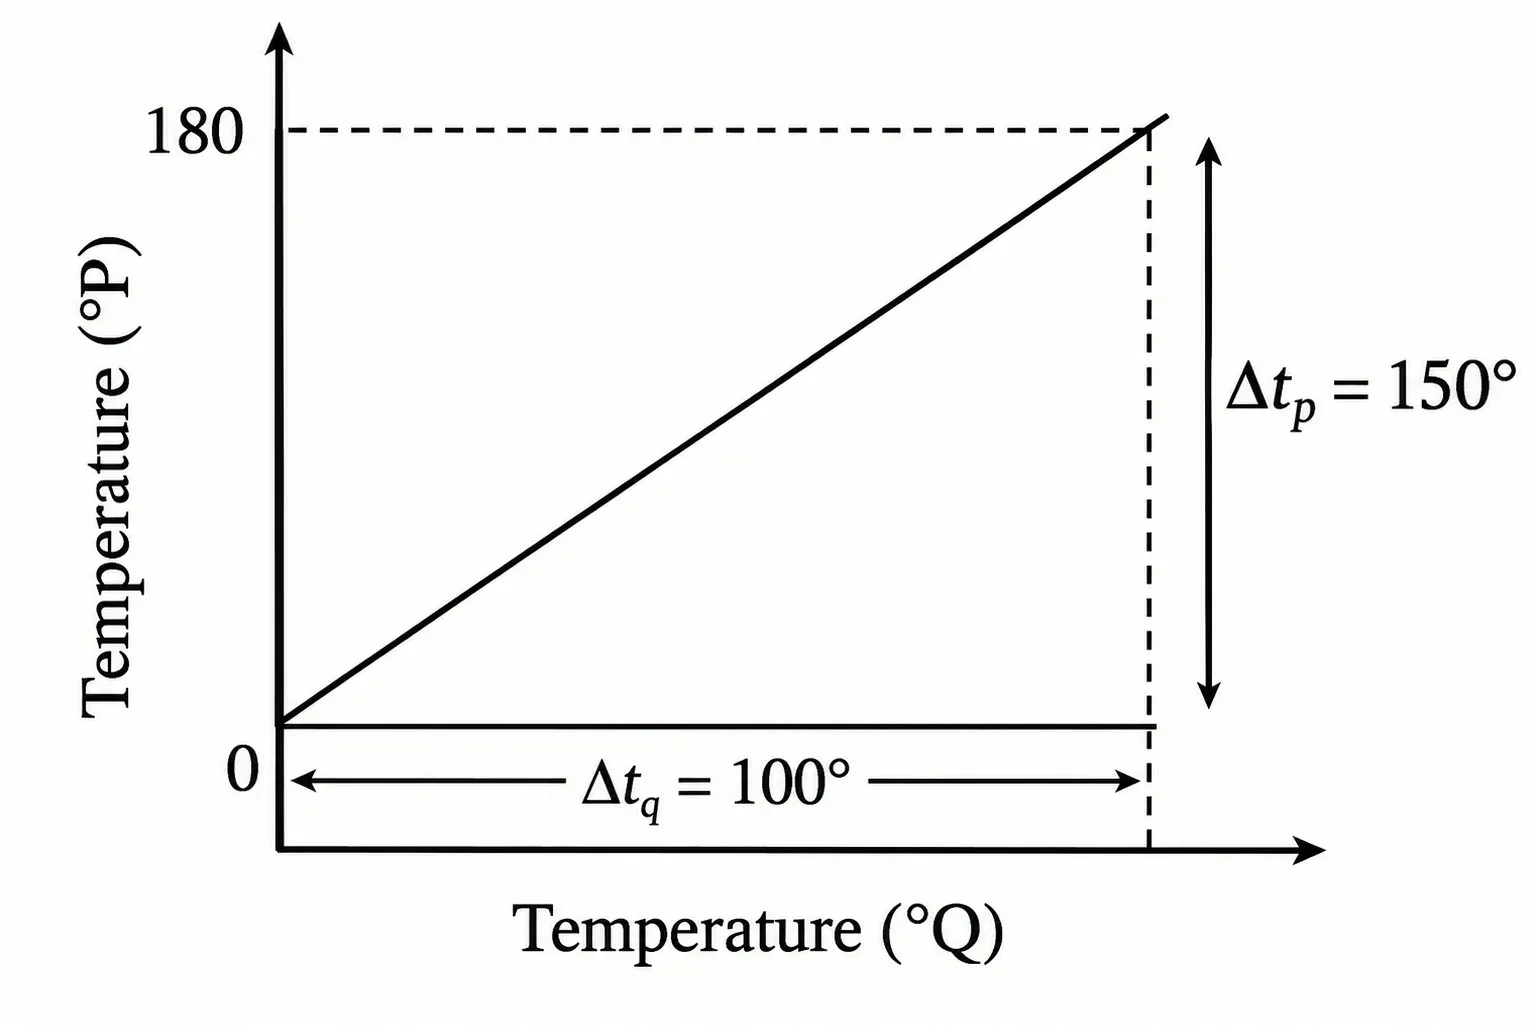
The graph between two temperature scales P and Q is shown in the figure. Between upper fixed point and lower fixed point there are 150 equal divisions of scale P and 100 divisions on scale Q. The relationship for conversion between the two scales is given by :
Physics · Thermodyanmics · heat and principle of calorimeter
The graph between two temperature scales P and Q is shown in the figure. Between upper fixed point and lower fixed point there are 150 equal divisions of scale P and 100 divisions on scale Q. The relationship for conversion between the two scales is given by :
Options