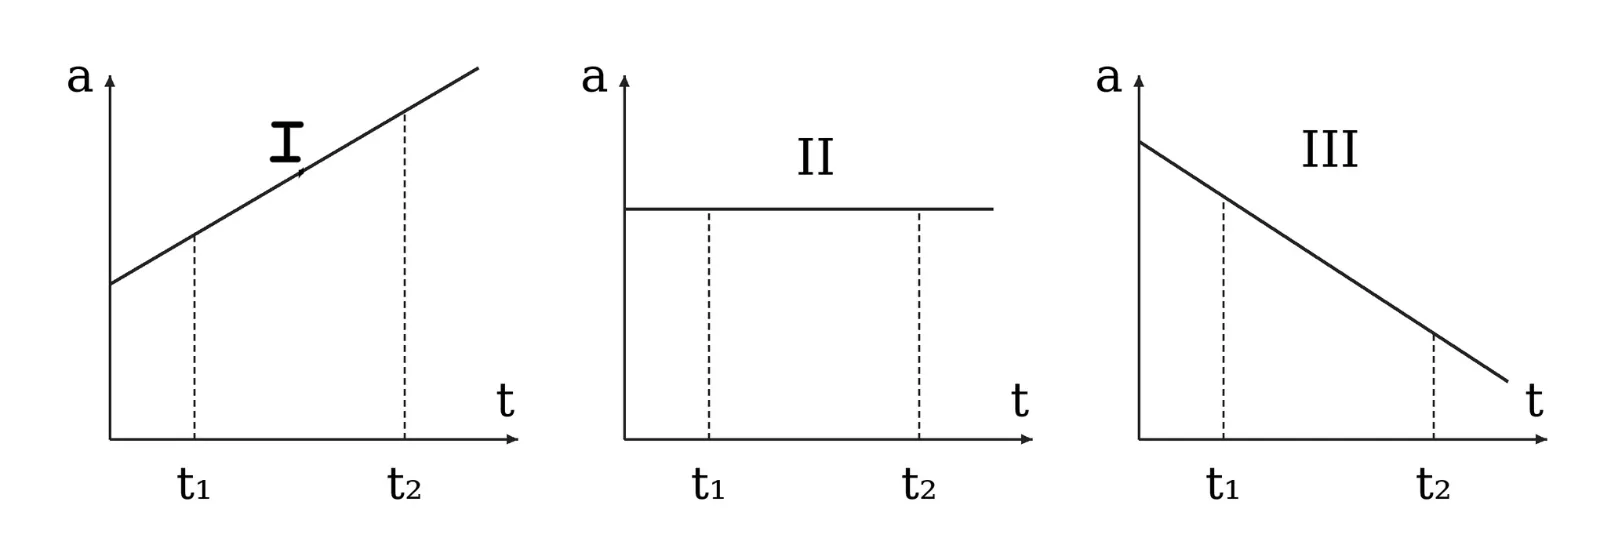
Each of three graphs represents acceleration versus time for an object that already has positive velocity at time t₁. Which graphs show speed increasing throughout t₁ to t₂?
Options
Each of three graphs represents acceleration versus time for an object that already has positive velocity at time t₁. Which graphs show speed increasing throughout t₁ to t₂?
Options