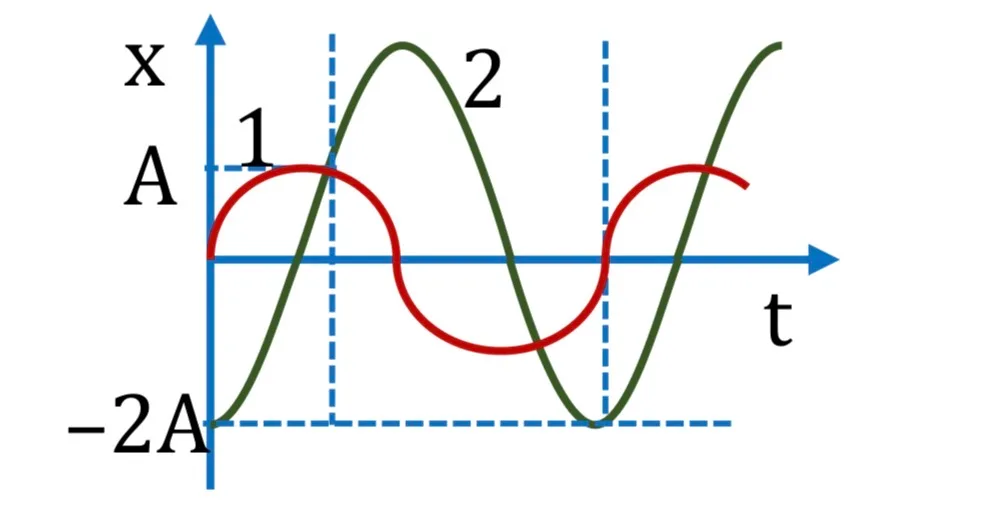
The oscillations represented by curve 1 in the graph are expressed by x = A sin(ωt). The equation for the oscillations represented by curve 2 is:
Options
The oscillations represented by curve 1 in the graph are expressed by x = A sin(ωt). The equation for the oscillations represented by curve 2 is:
Options